Biomedical waste data in India provides a national view of healthcare-facility coverage, waste generation, treatment and Common Bio-medical Waste Treatment Facility (CBWTF) infrastructure.
Primary source: CPCB Annual Report 2024. State-level reported figures may differ because of reporting periods, revisions and reporting scope.
India at a Glance
456,538
Healthcare Facilities
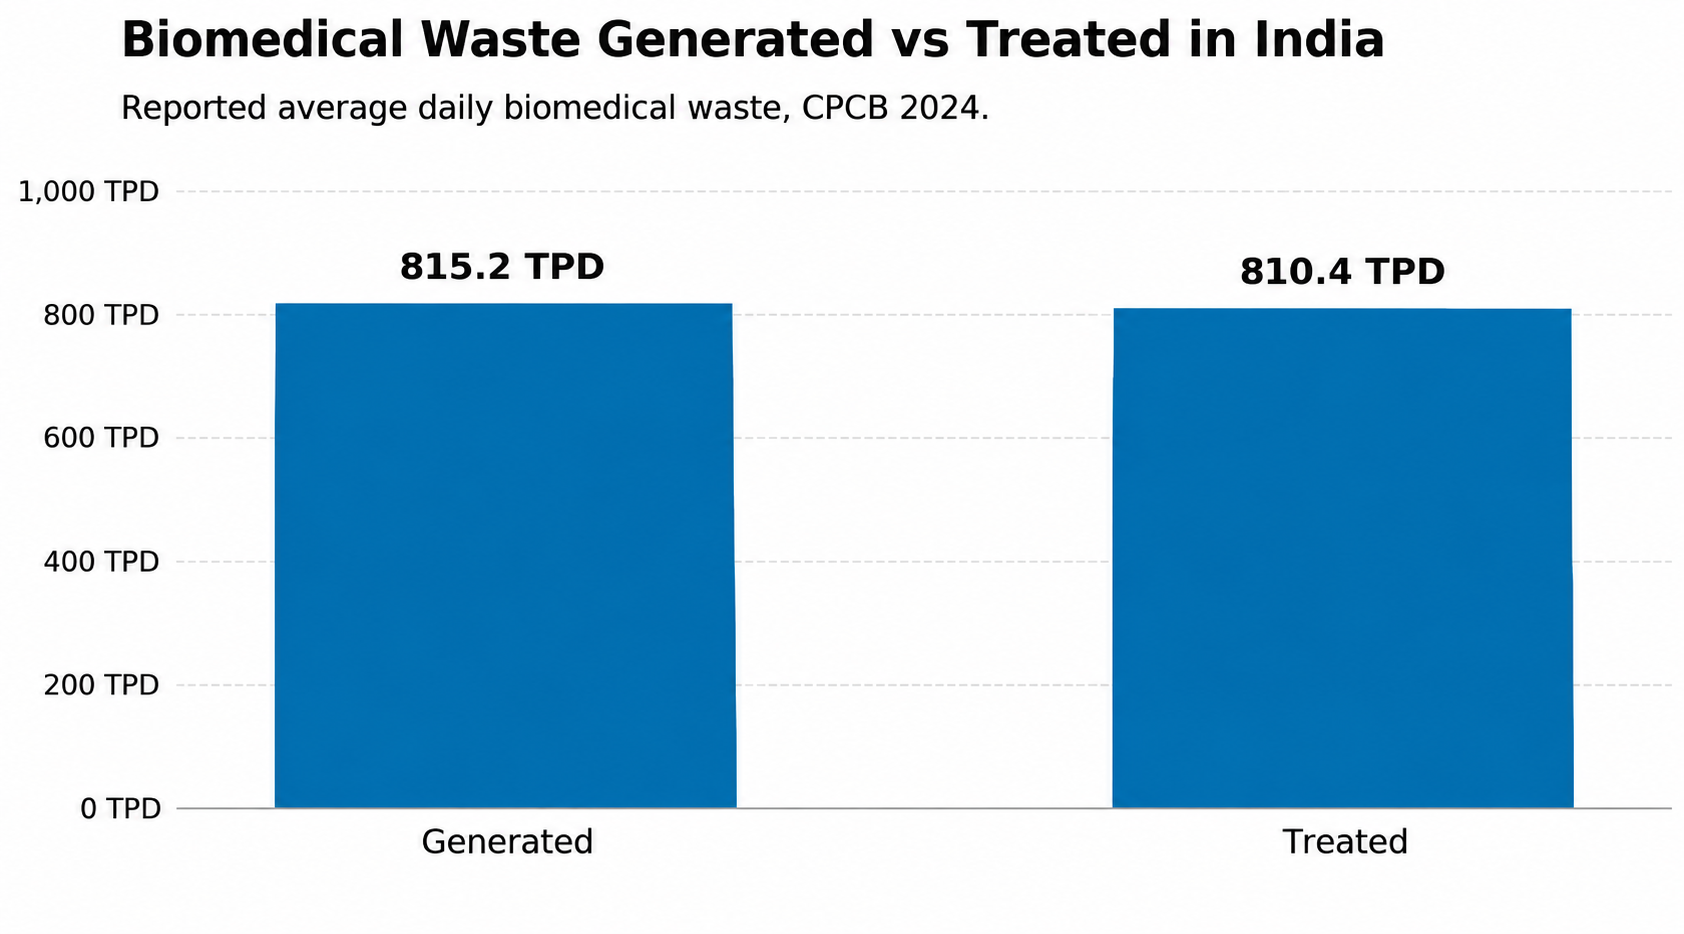
815.2 TPD
BMW Generated
810.4 TPD
BMW Treated
245
Operational CBWTFs
395,385 HCFs using CBWTF services | 30 CBWTFs under construction
99.4% Reported treatment rate
4.8 TPD Reported generation–treatment gap
Reported treatment is now very close to reported generation nationally, although treatment gaps remain in selected states.
Where Biomedical Waste Generation Is Concentrated
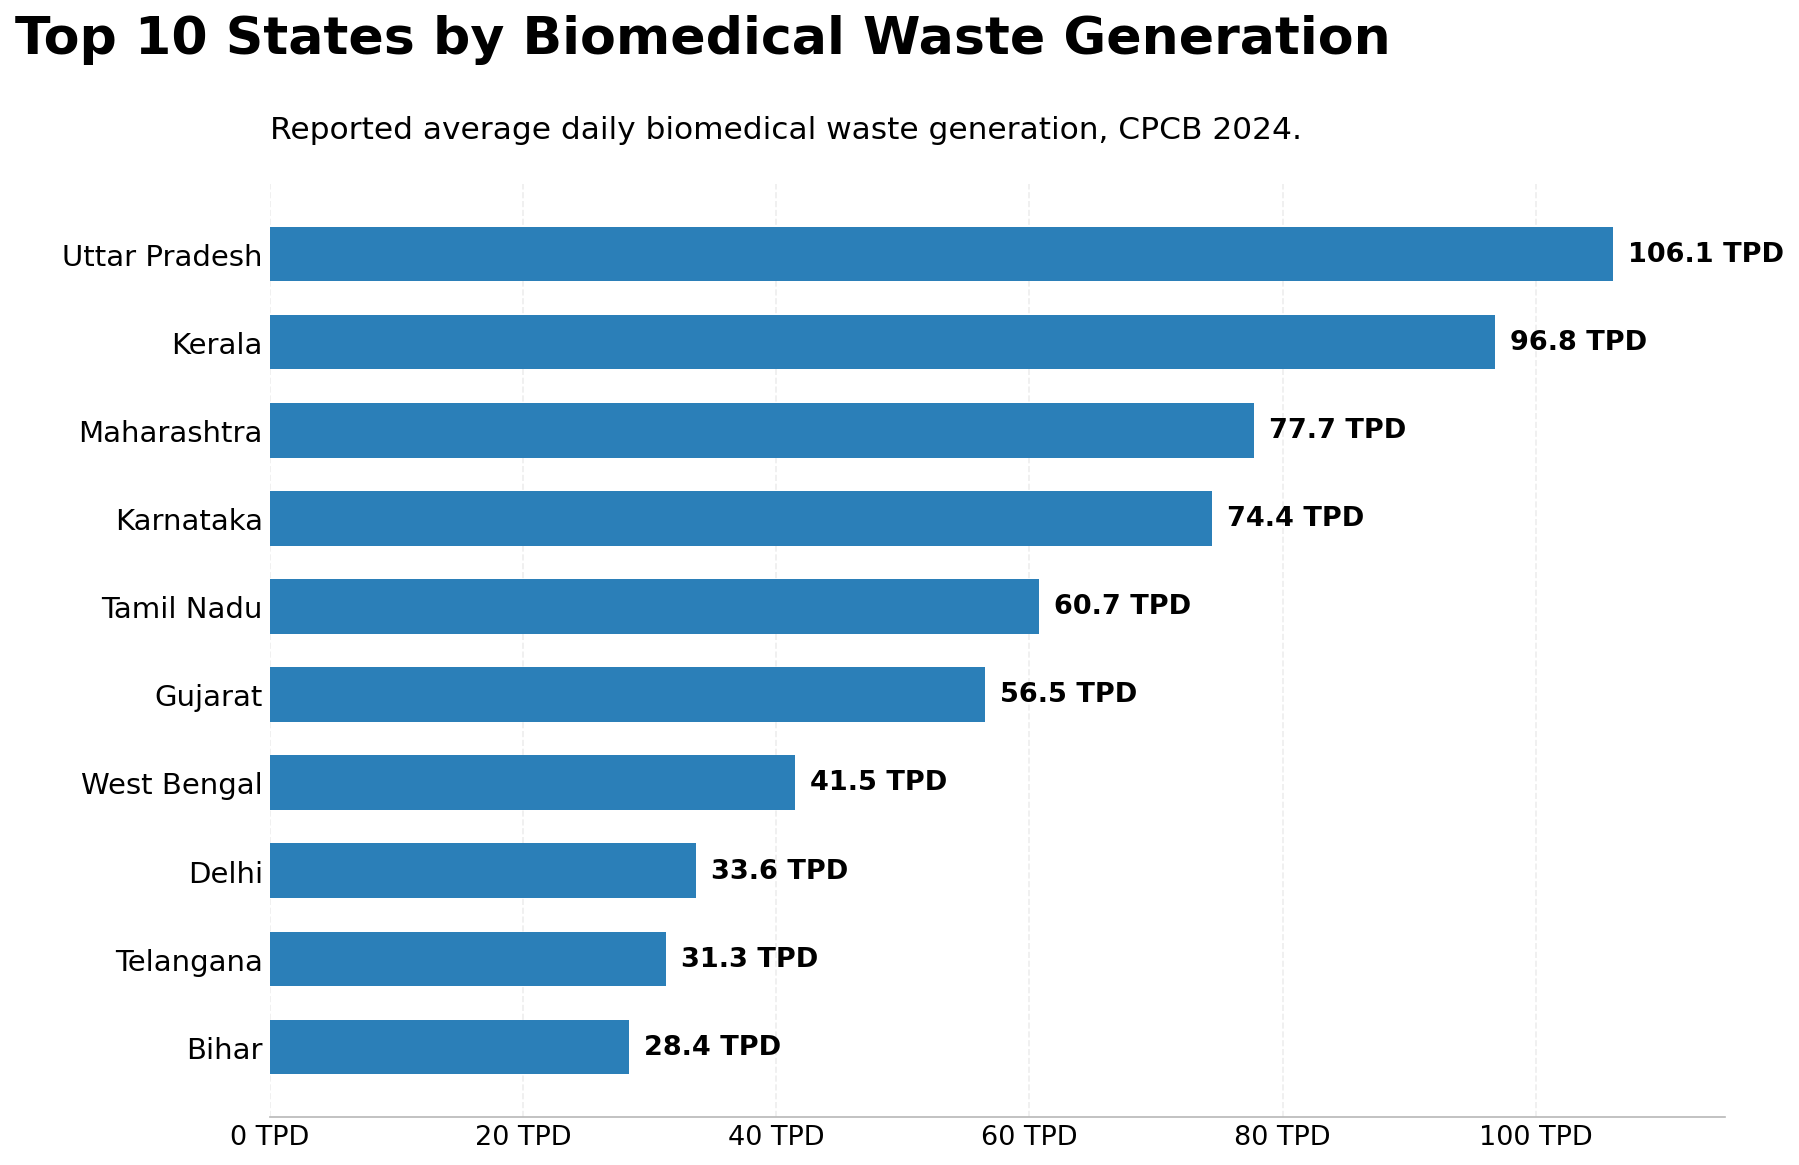
Biomedical waste generation is concentrated in a relatively small group of large states, but treatment infrastructure and coverage differ significantly within this group.
77.7–96.8 TPD Kerala and Maharashtra are the next two largest reported generators.
74.5% Share of national reported BMW generation represented by the Top 10 states
Where Reported Generation and Treatment Diverge
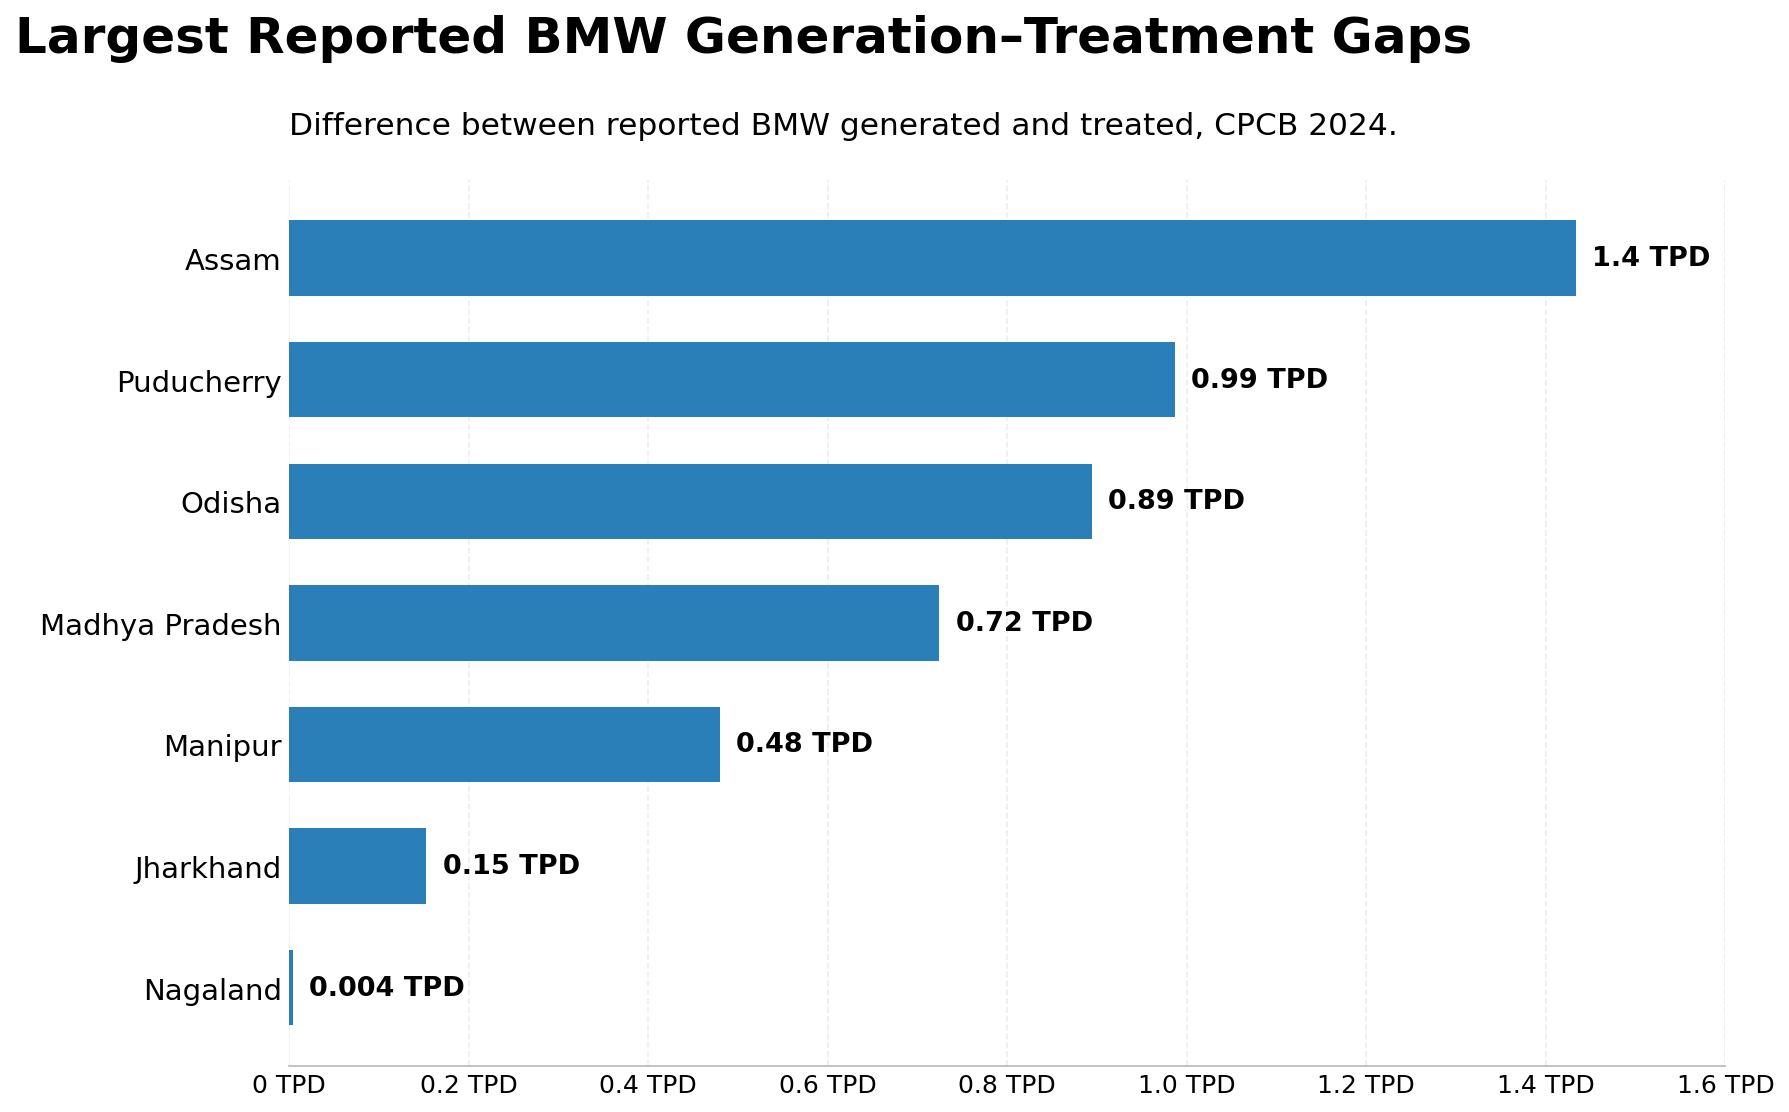
Assam, Puducherry and Odisha together account for about 69% of the reported national generation–treatment gap.
1.43 TPD Assam — largest reported generation–treatment gap
0.99 TPD Puducherry — second-largest reported gap
0.89 TPD Odisha — third-largest reported gap
A reported generation–treatment gap should not automatically be interpreted as untreated waste. Differences may also reflect reporting periods, definitions, treatment boundaries or data-quality issues and should be reconciled against state-level sources.
How Strongly Major States Are Connected to Common Treatment Infrastructure
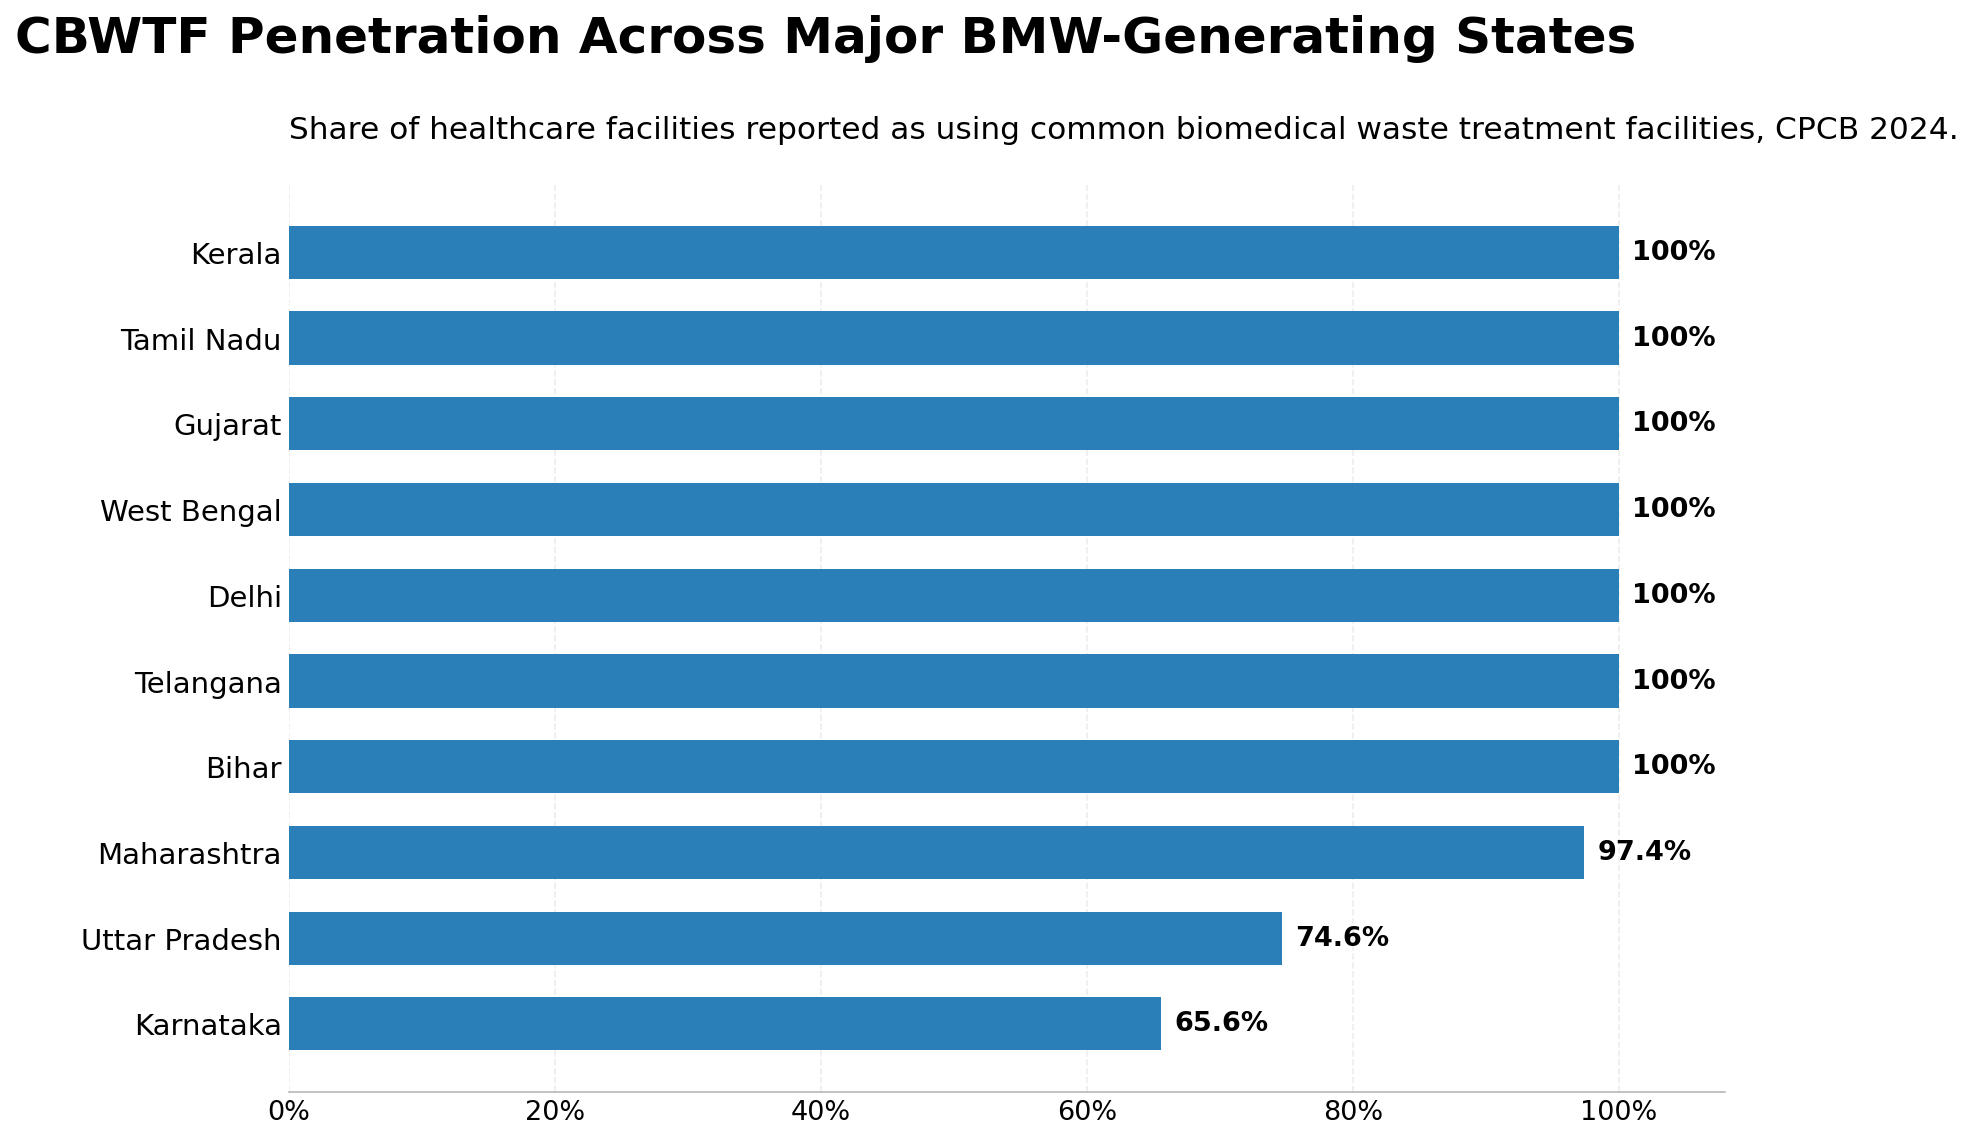
Common-treatment coverage is now very high across most major BMW-generating states, although Karnataka and Uttar Pradesh continue to show significantly lower reported CBWTF penetration.
100% Kerala, Tamil Nadu, Gujarat, West Bengal, Delhi, Telangana and Bihar report full CBWTF penetration among HCFs.
97.4% Maharashtra is effectively at full reported penetration
65.6% Karnataka has the lowest reported CBWTF penetration among the Top 10 BMW-generating states; Uttar Pradesh follows at 74.6%.
CBWTF penetration is the share of HCFs reported as using common treatment facilities. It should not be interpreted as a direct measure of treatment quality or overall compliance.
How Concentrated Are Common Treatment Networks?
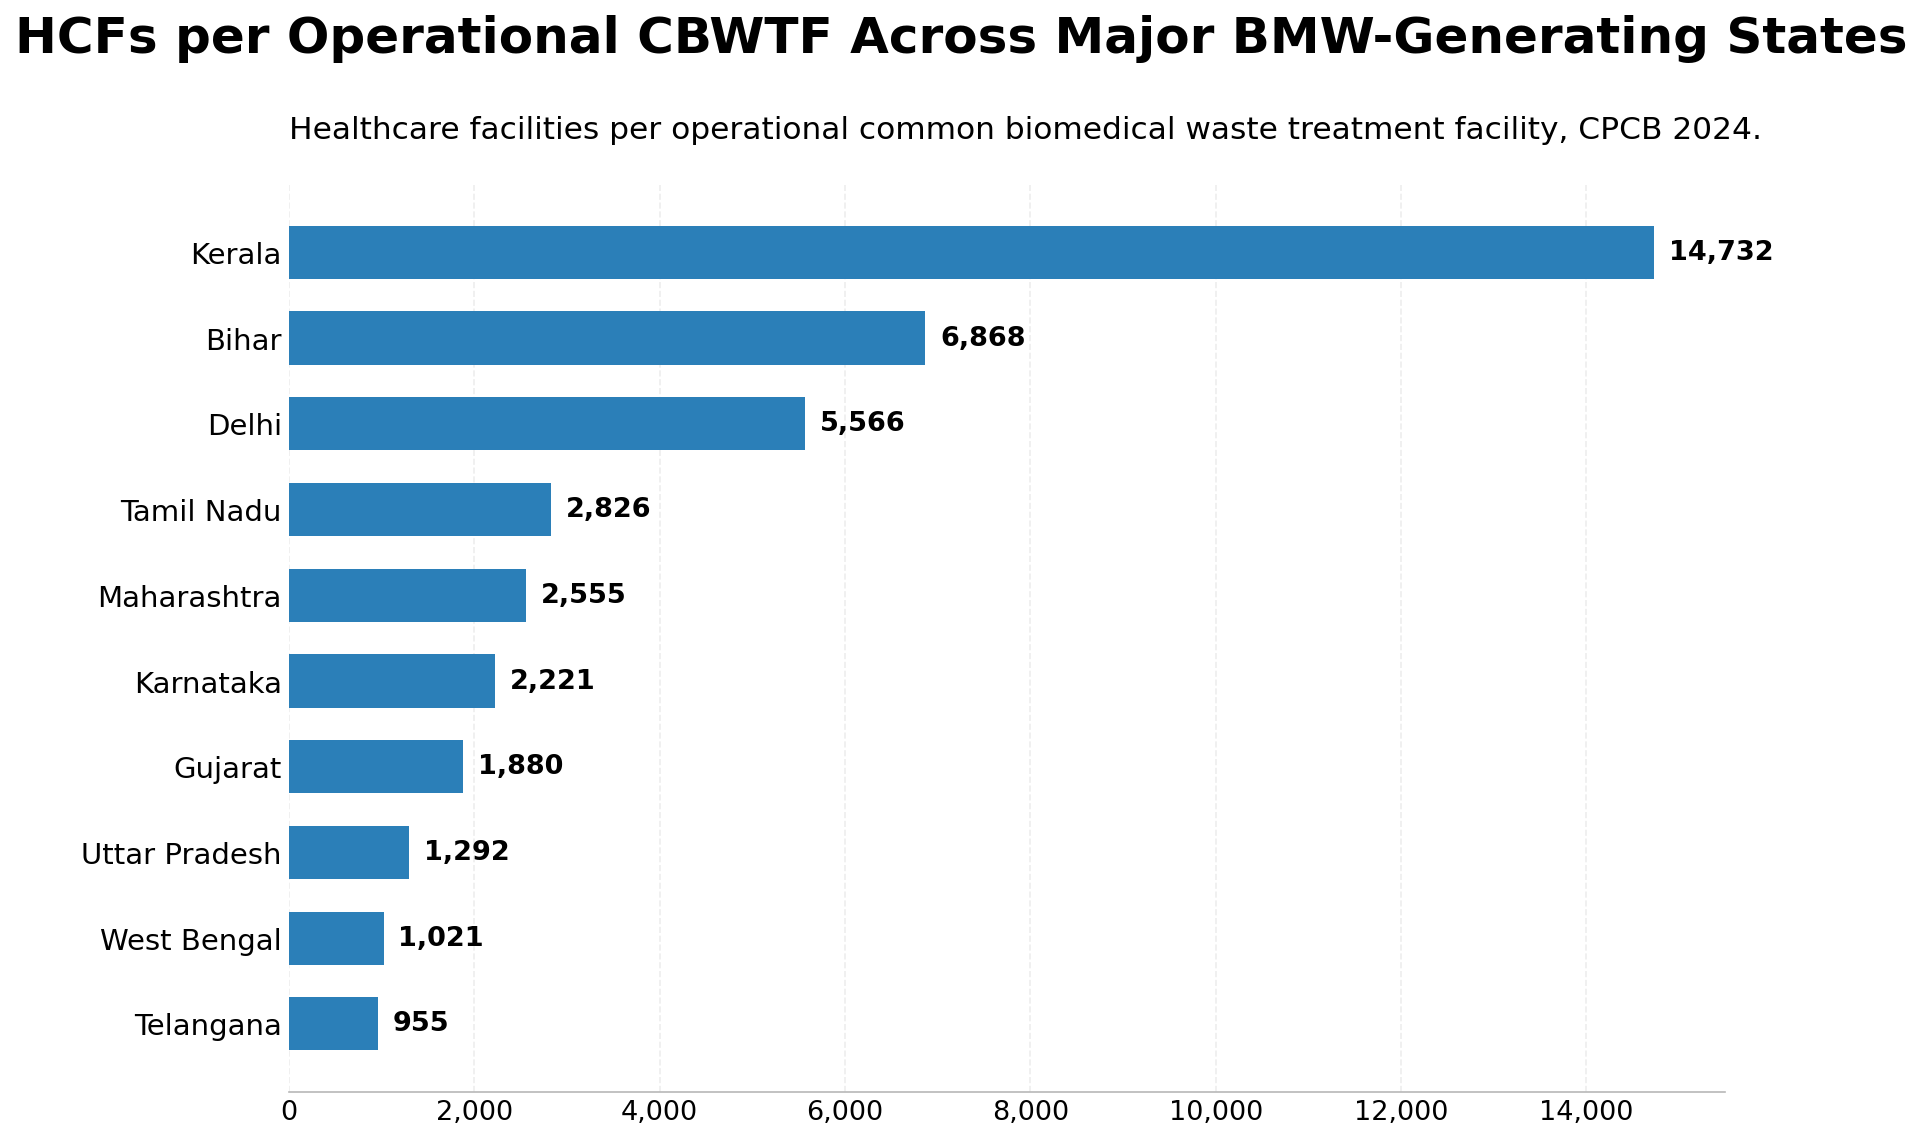
HCFs per CBWTF vary widely across major states, indicating very different levels of common-treatment network concentration.
14,732 HCFs / CBWTF Kerala has by far the highest ratio among the major BMW-generating states.
6,868 HCFs / CBWTF Bihar has the second-highest network concentration.
955 HCFs / CBWTF Telangana has the lowest ratio within this Top 10 cohort.
HCFs per CBWTF is an indicator of network concentration. It is not a measure of plant utilisation, treatment capacity, service quality or compliance.
What the Data Suggests
Biomedical waste activity is concentrated in a relatively small group of states
The Top 10 BMW-generating states account for about 74.5% of reported national biomedical waste generation, making them especially important when assessing collection networks, treatment infrastructure and capacity.
National treatment is now very close to reported generation
At the national level, about 99.4% of reported biomedical waste generation is treated. The remaining reported gap is concentrated mainly in Assam, Puducherry and Odisha, although the absolute national gap is now relatively small.
Common-treatment coverage is high, but not uniform
Most major BMW-generating states report very high HCF connection to CBWTFs. However, Karnataka and Uttar Pradesh show materially lower reported CBWTF penetration, indicating continued differences in treatment models and infrastructure coverage.
The number of healthcare facilities per operational CBWTF ranges from about 955 in Telangana to 14,733 in Kerala among the major BMW-generating states, reflecting very different network structures and operating models.
About the Data
This analysis primarily uses data reported in the CPCB Annual Report 2024 and derived indicators calculated from the reported state-level information.
Figures from CPCB and individual State Pollution Control Boards may differ because of reporting periods, definitions, revisions, treatment boundaries and differences in the scope of healthcare-facility reporting.
EarthRon therefore treats national and state datasets as separate observations where appropriate rather than automatically combining conflicting figures.
Derived indicators such as treatment rate, CBWTF penetration and HCFs per CBWTF are intended to support operational analysis and should not be interpreted independently as measures of regulatory compliance, treatment quality or plant utilisation.
Looking for Deeper Biomedical Waste Industry Insights?
EarthRon combines public regulatory information, operational experience and industry data to understand how biomedical waste systems operate across different markets.
Talk to us about state-level trends, treatment infrastructure, traceability, collection networks or operational data.